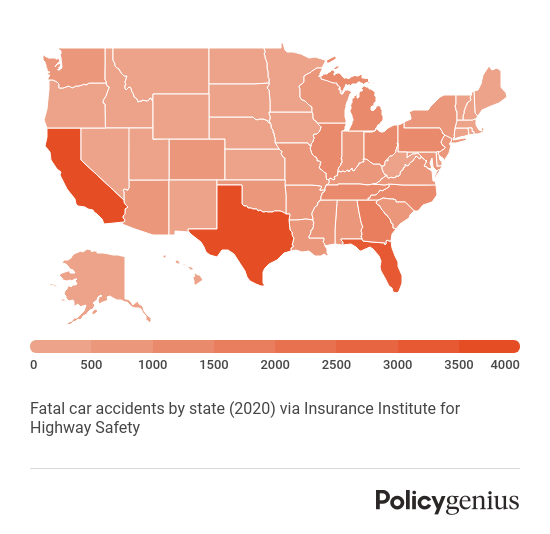
The number of car accident deaths varies greatly across all 50 states and the District of Columbia. There are a number of factors that can affect the statistics when comparing motor vehicle fatalities on a state by state basis, including weather, types of vehicles involved, number of passengers, travel speeds, topography, and more.
It’s also important to factor in a state’s population when examining the number of car accident fatalities in each state. Using data from the Insurance Institute of Highway Safety, we compared the number of motor vehicle fatalities in every state, taking into account each state’s total population.
Explore related topics
List of car accidents by state

Car accidents can happen everywhere, no matter what state you live in. In 2020, there were 35,766 fatal car accidents across the United States. The table below is a state-by-state breakdown of fatal motor vehicle crashes and motor vehicle crash deaths per all 50 states and Washington D.C. as of 2020, according to the IIHS. [1]
State | Population | Fatal crashes | Deaths |
|---|---|---|---|
5,024,803 | 852 | 934 | |
732,441 | 53 | 64 | |
7,177,986 | 967 | 1,054 | |
3,012,232 | 585 | 638 | |
39,499,738 | 3,558 | 3,847 | |
5,784,308 | 574 | 622 | |
3,600,260 | 279 | 295 | |
991,886 | 104 | 116 | |
690,093 | 34 | 36 | |
21,569,932 | 3,098 | 3,331 | |
10,725,800 | 1,522 | 1,664 | |
1,451,911 | 81 | 85 | |
1,847,772 | 188 | 214 | |
12,785,245 | 1,087 | 1,194 | |
6,785,644 | 815 | 897 | |
3,188,669 | 304 | 337 | |
2,935,880 | 382 | 426 | |
4,503,958 | 709 | 780 | |
4,651,203 | 762 | 828 | |
1,362,280 | 151 | 164 | |
6,172,679 | 540 | 567 | |
7,022,220 | 327 | 343 | |
10,067,664 | 1,011 | 1,084 | |
5,707,165 | 369 | 394 | |
2,956,870 | 687 | 752 | |
6,154,481 | 914 | 987 | |
1,086,193 | 190 | 213 | |
1,961,455 | 217 | 233 | |
3,114,071 | 293 | 317 | |
1,377,848 | 98 | 104 | |
9,279,743 | 547 | 584 | |
2,117,566 | 365 | 398 | |
20,154,933 | 963 | 1,046 | |
10,457,177 | 1,412 | 1,538 | |
778,962 | 96 | 100 | |
11,790,587 | 1,154 | 1,230 | |
3,962,031 | 599 | 652 | |
4,241,544 | 461 | 508 | |
12,989,625 | 1,060 | 1,129 | |
1,096,229 | 66 | 67 | |
5,130,729 | 962 | 1,064 | |
887,099 | 132 | 141 | |
6,920,119 | 1,119 | 1,217 | |
29,217,653 | 3,520 | 3,874 | |
3,281,684 | 256 | 276 | |
642,495 | 58 | 62 | |
8,632,044 | 796 | 850 | |
7,718,785 | 525 | 560 | |
1,789,798 | 249 | 267 | |
5,892,323 | 561 | 614 | |
577,267 | 114 | 127 | |
U.S. total | 331,501,080 | 35,766 | 38,824 |
→ Learn about how much car insurance rates go up after an accident
Car accident statistics at a glance
In 2020, the number of motor vehicle fatalities varied widely across all 50 states. California had the highest number of fatal crashes, 3,558, and Washington D.C. had the lowest, 34.
Population size is an important factor — California’s population is nearly 56 times that of Washington D.C., and Californians may be driving longer distances more frequently than D.C. drivers.
Insurance companies know that more people on the road can lead to more car accidents, which is part of the reason why drivers who live in big cities or dense areas often pay more for car insurance than drivers who live in less population-dense locales.
29% - Percentage of motor vehicle fatalities involving an SUV or pickup in Wisconsin in 2020
38,824 - Total number of fatalities from car accidents in all 50 states in 2020
55% - Percentage of deaths in single vehicle crashes nationwide in 2020
90% - Percentage of seat belt use by front seat occupants nationwide in 2020
$11,556 - The average medical cost for people injured in a car accident in 2020
13% - Percentage of all U.S. drivers who were uninsured in 2019, that’s one in eight drivers
43% - Percentage of motor vehicle deaths that occurred in rural areas nationwide in 2020
77% - Percentage of motor vehicle deaths in South Dakota that took place on rural roads in 2020
Data sources: Insurance Institute for Highway Safety, the Insurance Research Council, and the Centers for Disease Control and Prevention
States with the most car accidents
In 2020, the following states reported the highest numbers of fatal car accidents in the U.S.:
California: 3,847 deaths out of 3,558 accidents
Texas: 3,874 deaths out of 3,520 accidents
Florida: 3,331 deaths out of 2,950 accidents
Georgia: 1,664 deaths out of 1,522 accidents
North Carolina: 1,538 deaths out of 1,412 accidents
States with the least car accidents
The states with the lowest number of fatal car accidents are also some of the least populated, and are:
Washington, D.C.: 36 deaths out of 34 accidents
Alaska: 53 deaths out of 64 accidents
Vermont: 62 deaths out of 58 accidents
Rhode Island: 67 deaths out of 66 accidents
Hawaii: 85 deaths out of 81 accidents


