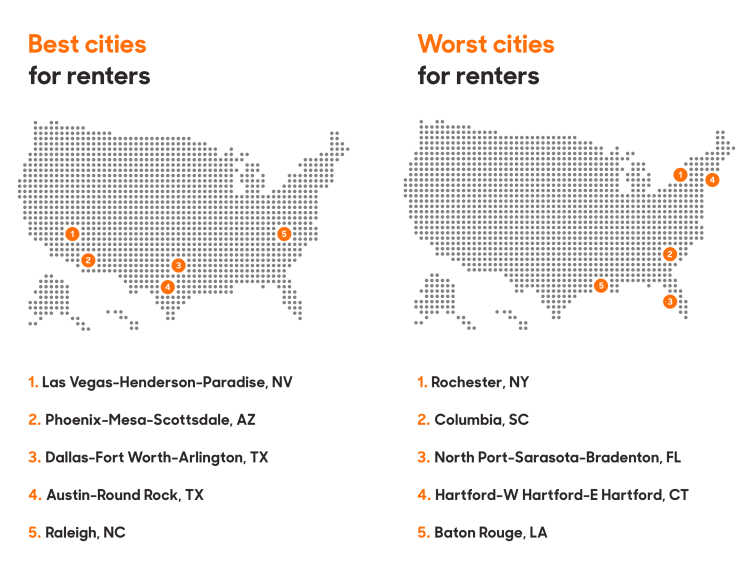
Renting is often a convenient choice for residents as it facilitates frequent relocation and doesn’t tie you down with financial commitments of a mortgage. According to a 2017 Pew Research Center study, more American households are renting than at any point in the last 50 years, and that number is projected to continue growing. There’s a lot to consider when renting a home, from the availability of housing to what you can get for the price in any given city. Last year we came up with the Policygenius Renters Index to learn which cities are the best and worst places to rent as opposed to own a home.

About the index
The second annual Policygenius Renters Index analyzed the 74 largest metropolitan statistical areas based on six figures, combined and weighted equally.
Price-rent ratio: This is a comparison of the costs of renting vs. buying. The higher the number, the more cost-effective it is to lease rather than buy a home, and the better a city scored on the index.
Renter-occupied units: The percentage of renters that comprise all occupied housing units.
Rental affordability: Housing affordability is relative, since it accounts for one’s total housing costs as a percentage of their income. Bigger cities typically boast higher rents, but also higher incomes. Personal finance experts generally recommend putting no more than 30% of your income toward housing, so the affordability score measures the percentage of a city’s renters whose total housing costs are less than a third of their income.
Price per square foot: This is the median price per square foot for single-family homes, condos and co-op rentals, as measured by the real estate company Zillow. A cheaper price dictates a better deal.
Air quality: The median air quality rating for each metro area for 2018.
Crime rate: The rate of property crime — arson, burglary, larceny and motor vehicle theft — per 100,000 people. In 2017, the national rate of all property crime offenses was 2,362.
We compiled these numbers to make the Policygenius Renters Index. Each city-metro is rated on a scale of 0 to 100.
Data sources: Zillow for price-rent ratios and price per square foot index data, the U.S. Census Bureau’s American Housing Survey for rental data, FBI for crime rates, and the EPA for air quality index figures.
Best cities for renters
Bet on Vegas
Sin City consistently ranked above average in multiple categories, including the price-rent ratio, property crime, and price per square foot. But it was the high air quality and percentage of rental units that helped Vegas land the number one spot.
Rally for Raleigh
Despite being more of a buyer’s market than a renter’s — rentals make up less than 34% of all occupied housing units — North Carolina’s capital scored equally well on both price per square foot and crime. It is also ranked second-highest in affordability: over 52% of its renters spent less than a third of their total income on housing.
Go west
Phoenix had the highest air quality out of the city-metros we surveyed. California had four cities in the top ten and Texas had three. The data shows that while apartments are more expensive in California cities — for example, $2.17 per square foot in San Diego, and $2.65 per square foot in San Jose, the third highest-priced in the index — you're still better off renting than buying, according to the price-rent ratios.
El Paso, by comparison, will give you your money’s worth for bigger space — ranking second best with $0.78 per square foot. The city metros of Austin and Dallas-Fort Worth fared similarly to each other, although the latter is a slightly better option to own.
Bigger cities aren’t necessarily worse for renters
It’s common knowledge that homes in NYC and LA are both cramped and unaffordable. Nearly 44% of New York City renters and 39% of Los Angeles renters put a third of their paycheck toward housing costs. But for most renters in these cities that might be the only choice; renters make up most of the residents — 48% of occupied homes are inhabited by renters in New York City and over 51% in Los Angeles.
New York City also happens to be very safe; in fact, it’s the second-safest city on our list. The property crime rate of 1,449 per 100,000 people falls well below the national average. (That doesn’t mean you should skimp out on renters insurance though. We’ll talk more about that later.)
Worst cities for renters
The metropolitan areas that scored lowest on the index were:
Rochester, NY
Columbia, SC
North Port-Sarasota-Bradenton, FL
Hartford, CT
Baton Rouge, LA
Some of the cities that scored low in the index have high rates of property crime, sometimes up to 60% higher than the national average. Residents might do well to have renters insurance, which would help replace their items in the event of theft, fires, and other property hazards.
The North Port metro area, on the other hand, has very little property crime, but came in second-to-last place for rental stock. Renters only make up 27.5% of overall occupied housing units. Even if you live here, you should still consider getting a renters policy since renters insurance covers you and your belongings wherever you are.
The upside
Even though these cities ranked toward the bottom of the index, that doesn’t mean they’re without their benefits; in some cases, it might simply be more advantageous to own rather than rent. Rochester, for example, was the most cost-effective city to own instead of rent, according to last year’s Policygenius renters index about the savviest renters. It remains the best bet for homeowners, as opposed to renters, again this year.
Use the interactive chart to sort through the different criteria for your city.
